
In this article we will connect a CosmosDB graph collection to PowerBI to enable various kinds of reporting based on the dataset. We will be using the built-in CosmosDB connector available in PowerBI Desktop to connect and access data from our graph using both a wizard-like visual way as well as a more code driven approach.
First up, open PowerBI desktop and find the CosmosDB Connector:
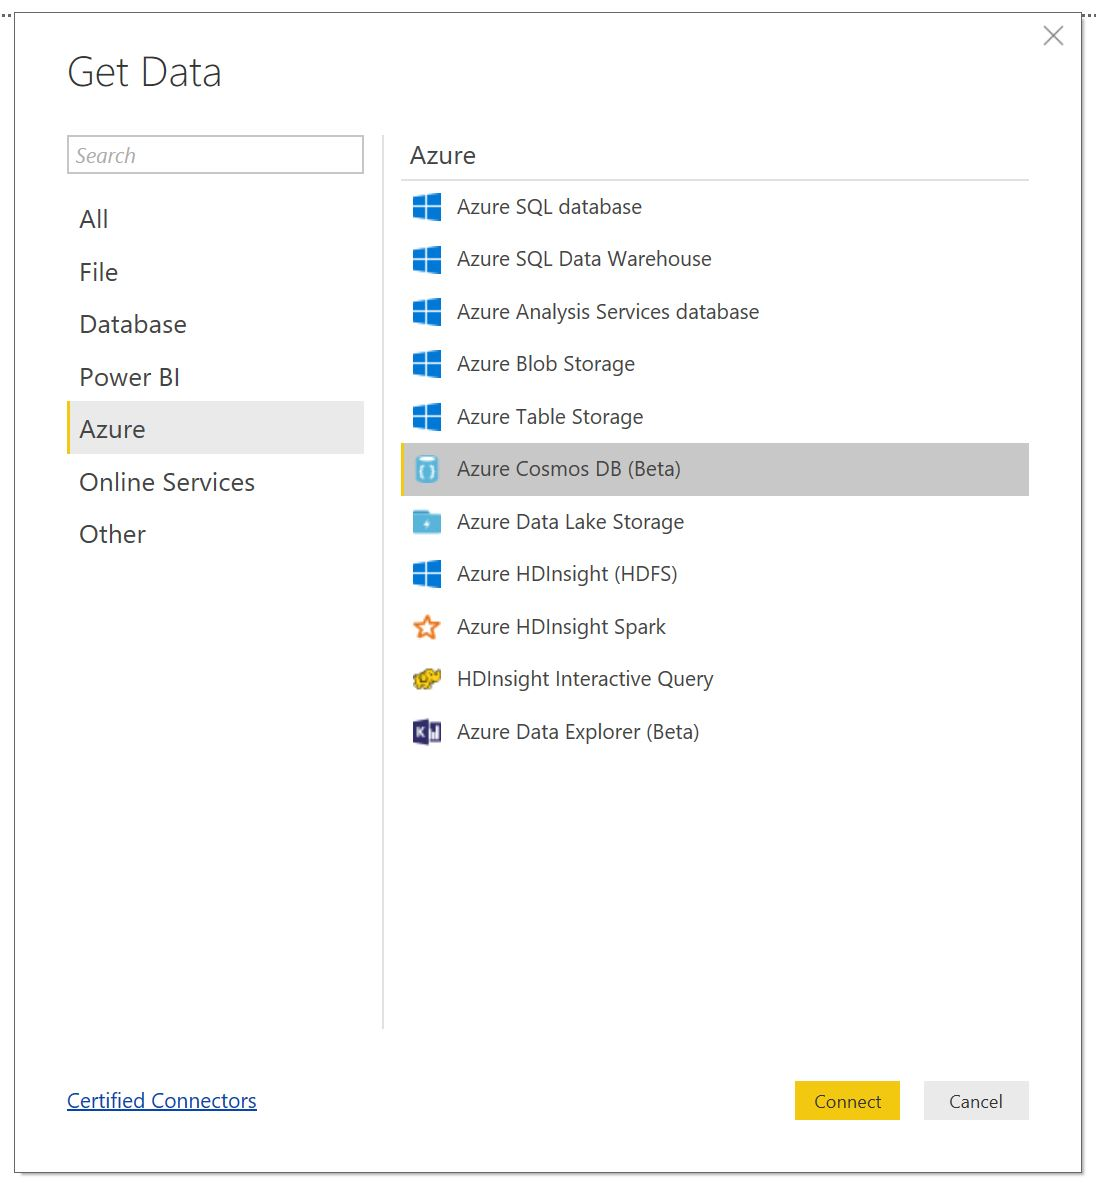 Connecting to database
Once basic information is provided, PowerBI will ask for the database account key which you should be able to grab from the Azure portal. I recommend using the read-only key, even if there’s no real danger of making changes, for security purposes, this will be one less full access key you need to worry about
 Read-only access key
The data
For this post, I’ll be working with a sample database representing an overly simplified transaction database stored in a graph format as seen below. We will only use one group of nodes - the ‘Order’ node to demonstrate how to extract data in a PowerBI ready format
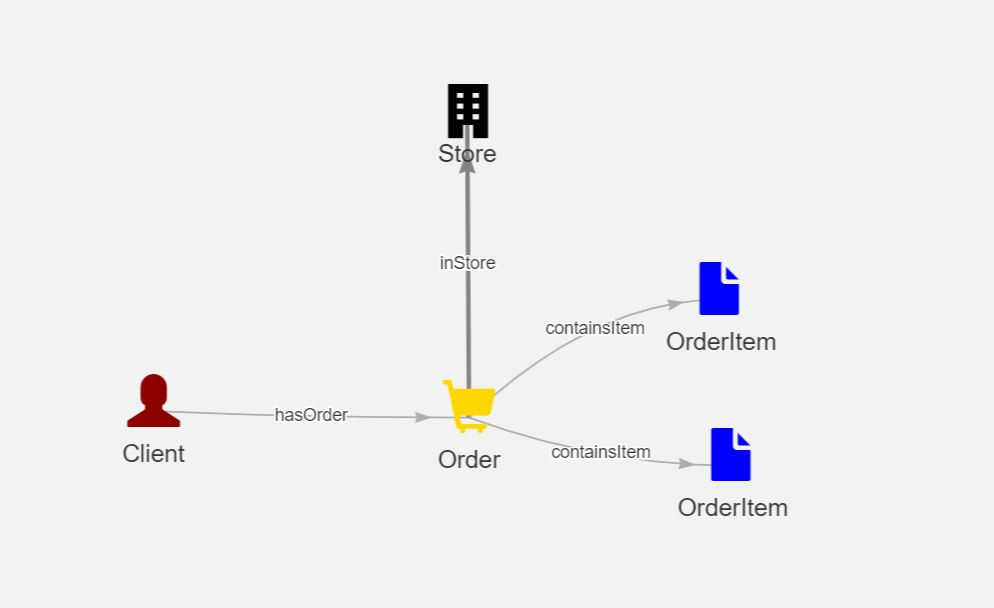 Graph schema
Building the dataset via designer
We will use a combination of the visual designer and the advanced query editor found in PowerBI to get the data from the graph. Because we have not specified a default query in our connection, the default query and dataset will be select * from c which in CosmosDB means return all the documents in the collection. Obviously that’s not what we want and we want to customize the query and potentially add more queries to return data we need.
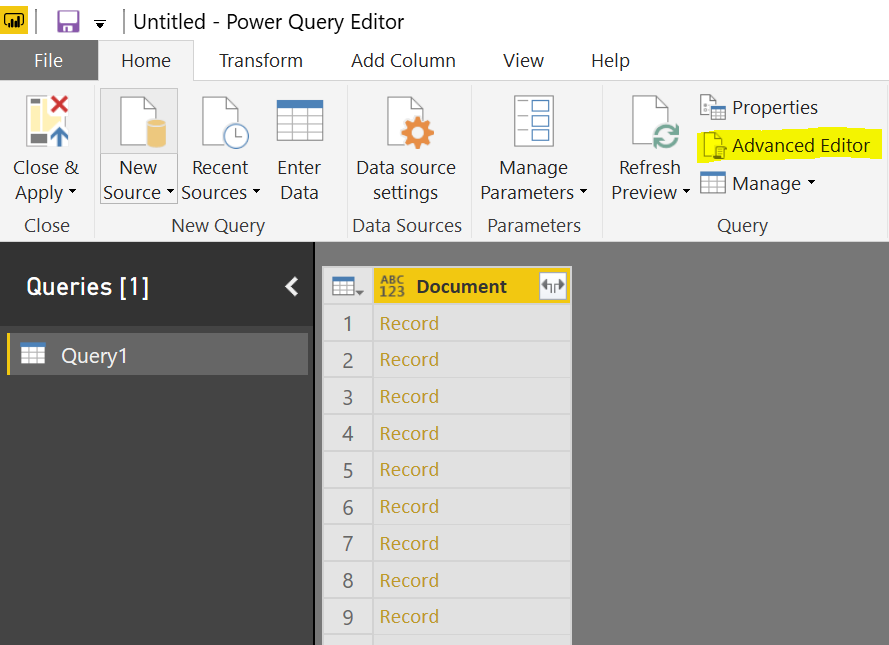
We will update the current query - Query1 via the Advanced Editor screen. (right click on the query node, or see button in the ribbon bar highlighted in the screenshot above).
The default source code behind the query should be something like this:
1 | let |
Update the query to this and hit Done
1 | let |
Once you’re back to the preview window, you’ll see something similar to the screen before. All Rows returned by the query are shown as a simple “Record” with no columns associated to it. The reason for that is that every record in a CosmosDB database is represented as a JSON document and we need to expand that Json document and its properties into a tabular format. Restricting our query just to documents of a certain label ensures us that all documents returned by the query share the same structure.
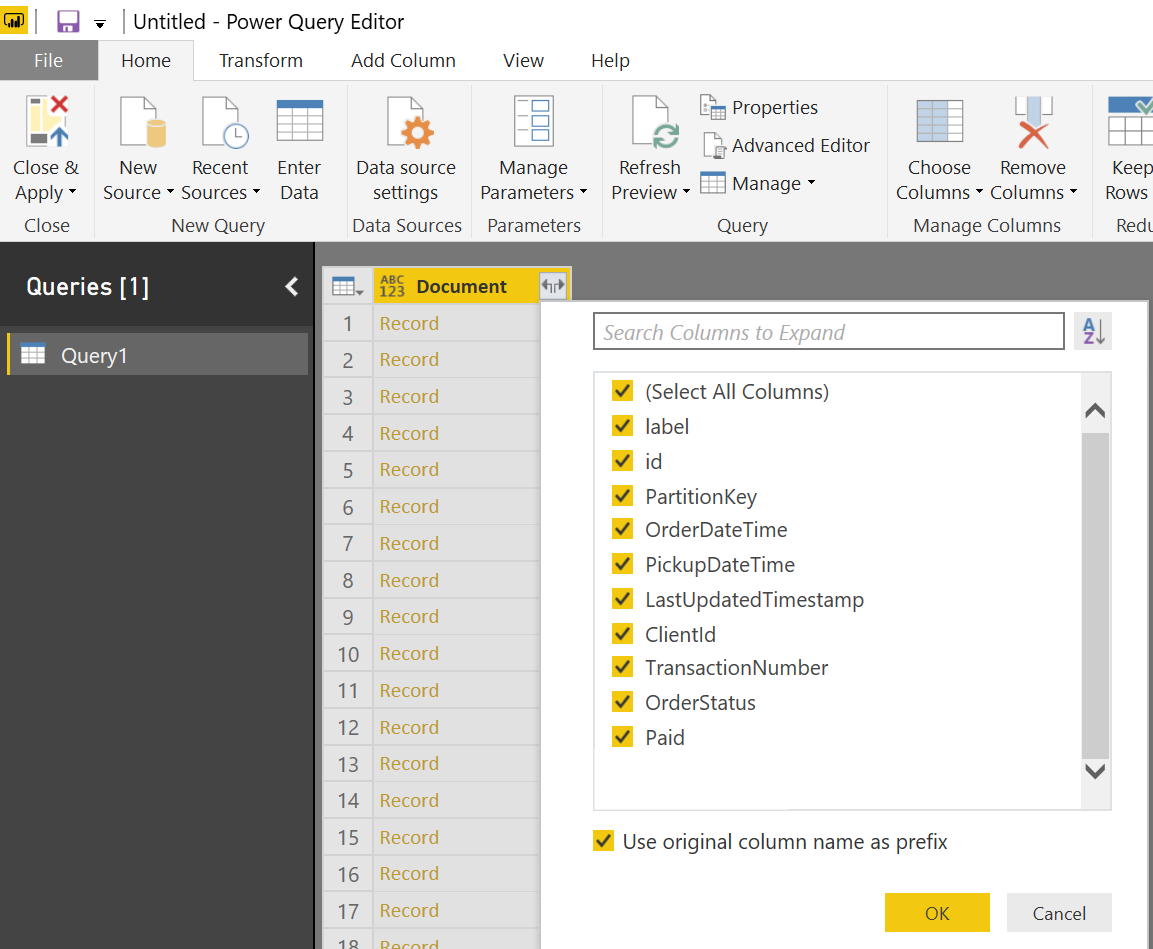
To expand the document into columns, we need to use the Expand columns feature as shown below.
 Expand columns
Choose only columns that are going to be relevant for your dashboards or relationships. Keeping the dataset lean and clean will make refreshes and future processing faster (i.e. I excluded the label column because it’s always the same as per our query.
Once expanded our preview will look as below:
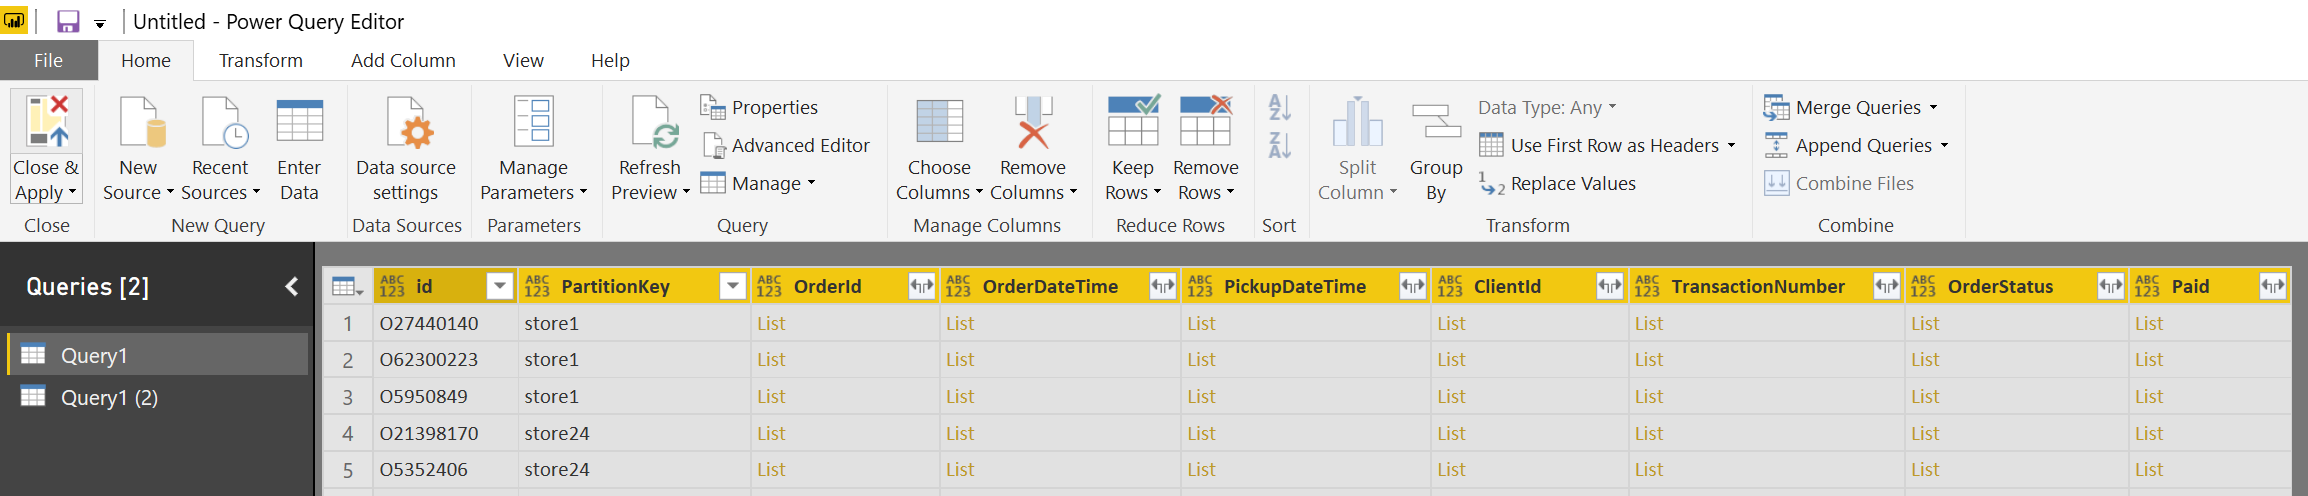 Expanded columns
We’re now one step closer to finalizing the dataset. The last remaining issue is that most of the columns show as a List. This has to do with the GraphSON format and the fact property values are stored in an array when the document is part of a graph. This means we need an extra step to extract the value from the property by expanding the list and taking the first value. To achieve that we use the Expand to new row functionality along with an extra step of Expand Record and selecting the _value property
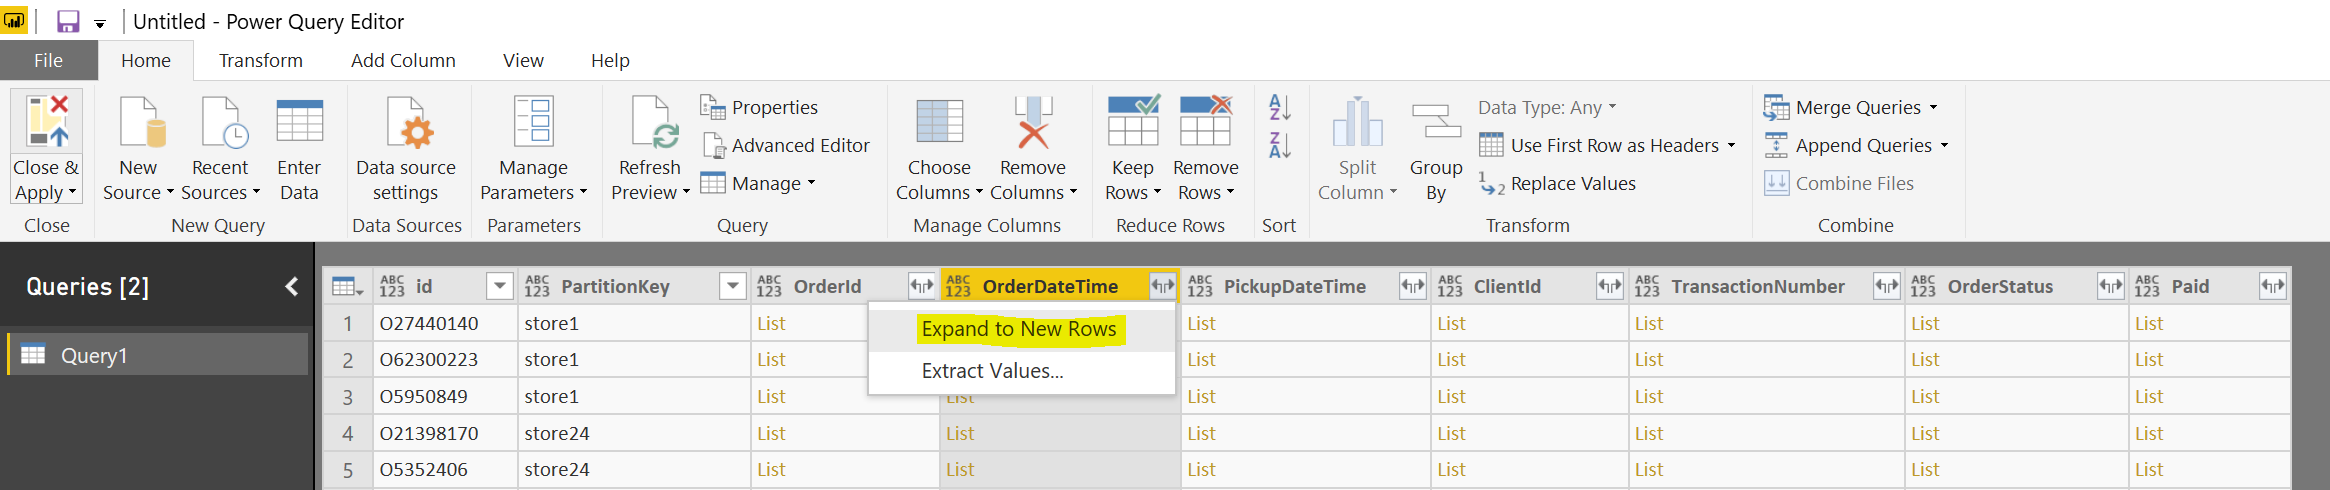 Expand to new row
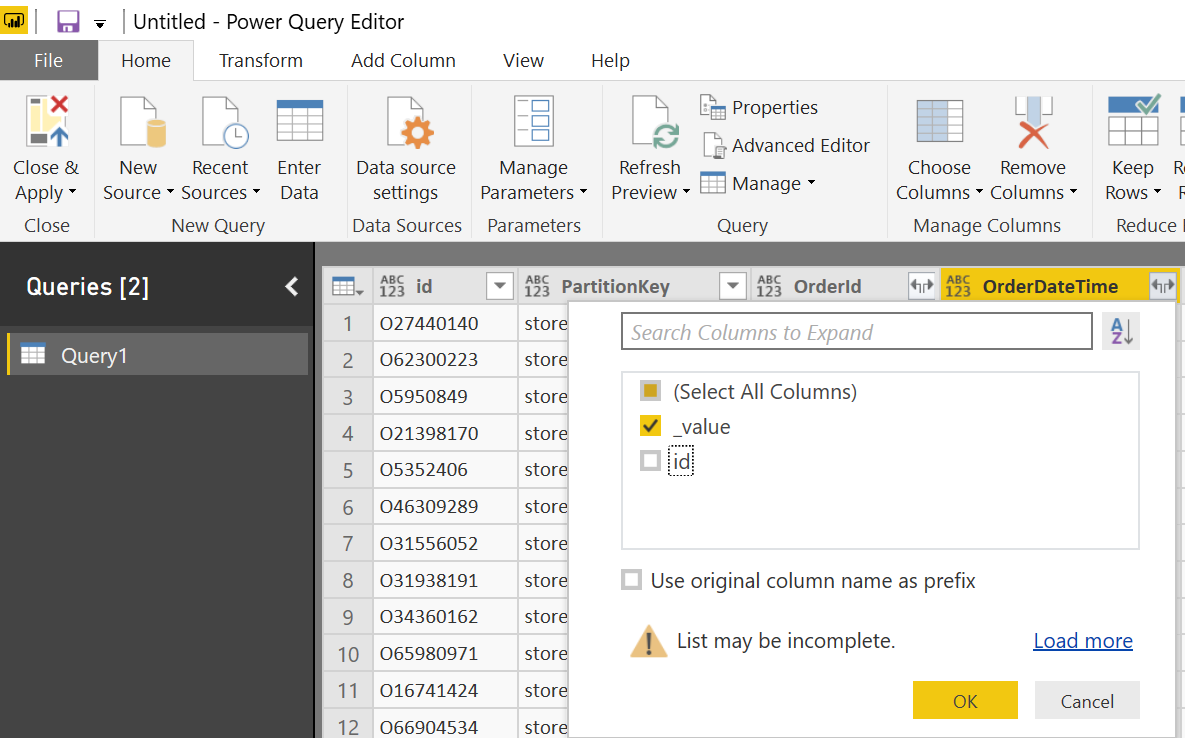 Expand value to column
Repeat the steps for all the properties you need to expose in your dataset and you’re done.
Building the dataset via query
Another way to achieve the same result is to model the initial query to return data a bit differently. In the visual way of doing things, most effort was expanding each property and extracting the value out of it. There is a way to simplify that process, by complicating the initial query a bit as such:
1 | let |
Essentially we are selecting the _value property directly from the document which will return a simpler to expand document with no performance or cost penalty.
In the end we obtained a clean dataset that can be used in Visualizations.
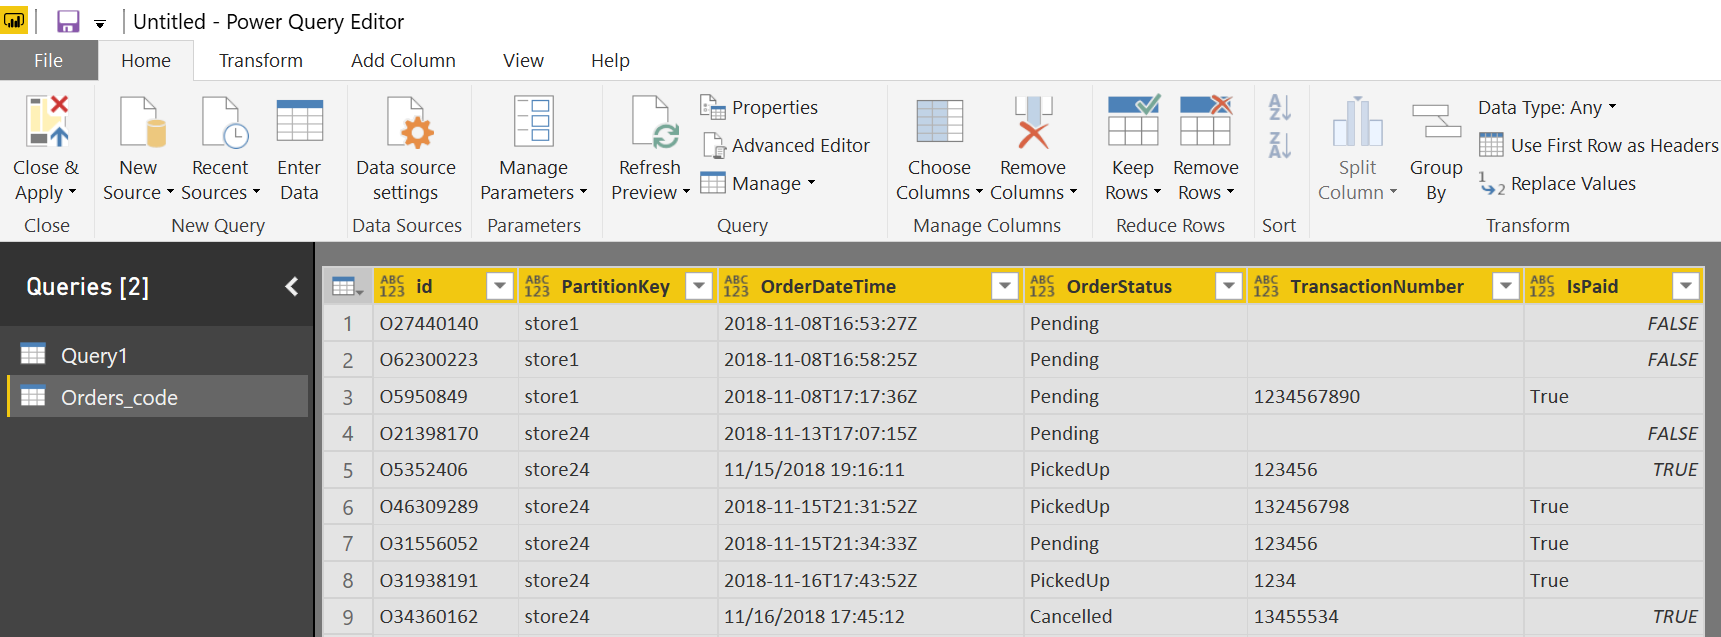 Finalized dataset